See your whole fiber network — and its blast radius
Map every site, device, fiber strand and customer port, then answer the question that matters during an outage: exactly who is affected?
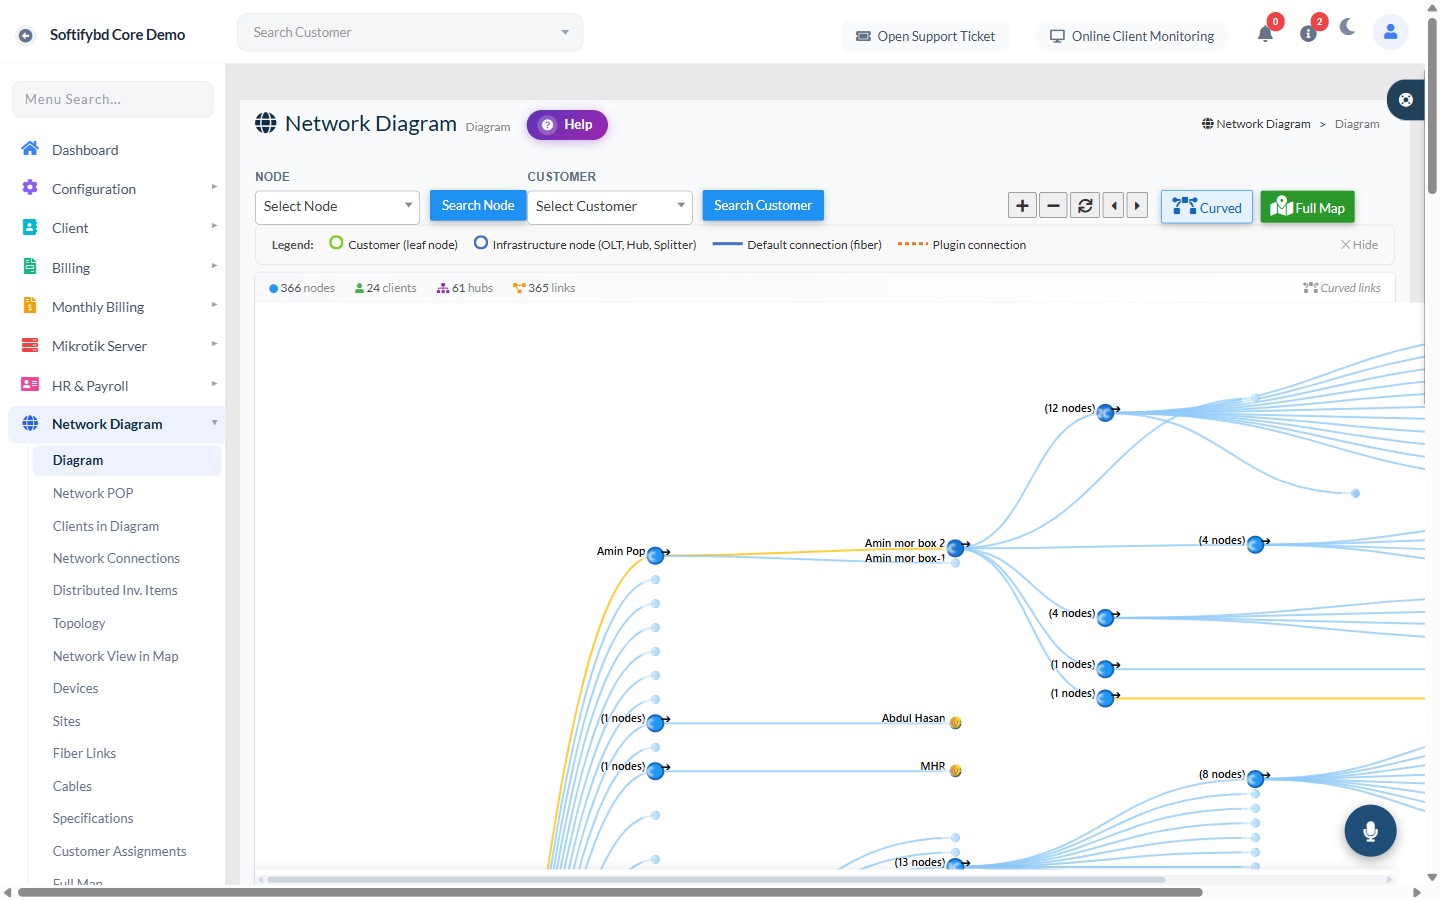
Fault-impact blast radius
Click any device and instantly see which downstream devices and paying customers go dark if it fails — affected counts and the full list, computed across your topology.
Two fiber granularities
Model the physical cable bundle (with GPS route geometry) and the individual strand (attenuation in dB, wavelength 1310/1490/1550 nm, A/Z ports, 12-colour code).
Scissor mode
Cut a cable at a click point and reconnect to a different device; both halves inherit type, cost and colour, and distances recompute automatically.
Customer ↔ port binding
Bind each customer to a device port for accurate port-utilization and per-customer upstream tracing — the basis of fault analysis.
Built for real networks at real scale
See exactly what ISP Digital recovers for your ISP.
Book a 30-minute demo. We'll map your billing, network and accounting onto the platform and show you the numbers — no obligation.